product strategy
Interaction Design
design system
NASA
Turning Global Greenhouse Gas Data into a Decision-Support Platform
Turning Global Greenhouse Gas Data into a Decision-Support Platform
Turning Global Greenhouse Gas Data into a Decision-Support Platform

Product Outcome
Launched the first unified U.S. greenhouse gas data platform, connecting data from NASA, EPA, and NIST into a single decision-support experience for scientists, policymakers, and the public.
Timeline
2025 – 2026
2025 – 2026
2025 – 2026
Role
Senior UX Designer
Senior UX Designer
Senior UX Designer
Reusable Template Slot
Reusable Template Slot
Swap this column for team, scope, tools, constraints, or platform context in future case studies.
Swap this column for team, scope, tools, constraints, or platform context in future case studies.
The problem
Multi-agency climate data scattered across siloed repositories with no unified point of access.
Multi-agency climate data scattered across siloed repositories with no unified point of access.
Multi-agency climate data scattered across siloed repositories with no unified point of access.
The U.S. had no single platform where scientists, policymakers, and the public could access, explore, and understand greenhouse gas emissions data. Critical datasets from NASA, EPA, and NIST lived in separate systems with different formats, access patterns, and terminology.
The U.S. had no single platform where scientists, policymakers, and the public could access, explore, and understand greenhouse gas emissions data. Critical datasets from NASA, EPA, and NIST lived in separate systems with different formats, access patterns, and terminology.
The U.S. had no single platform where scientists, policymakers, and the public could access, explore, and understand greenhouse gas emissions data. Critical datasets from NASA, EPA, and NIST lived in separate systems with different formats, access patterns, and terminology.
The challenge wasn’t just designing an interface. It was defining what a decision-support platform should be for an audience ranging from atmospheric scientists to Congressional staffers, and building the information architecture to serve them all.
The challenge wasn’t just designing an interface. It was defining what a decision-support platform should be for an audience ranging from atmospheric scientists to Congressional staffers, and building the information architecture to serve them all.
The challenge wasn’t just designing an interface. It was defining what a decision-support platform should be for an audience ranging from atmospheric scientists to Congressional staffers, and building the information architecture to serve them all.
Product Strategy
Designing for decision-making across expertise levels
Designing for decision-making across expertise levels
Designing for decision-making across expertise levels
Rather than building a data catalog, I advocated for framing the platform around user decisions: What question is someone trying to answer? What action will they take with this data? This shifted the product from data access to data-informed action.
Rather than building a data catalog, I advocated for framing the platform around user decisions: What question is someone trying to answer? What action will they take with this data? This shifted the product from data access to data-informed action.
Rather than building a data catalog, I advocated for framing the platform around user decisions: What question is someone trying to answer? What action will they take with this data? This shifted the product from data access to data-informed action.
I led workshops with stakeholders across all three agencies to align on a shared taxonomy and navigation model. The key strategic insight was that scientists and policymakers needed fundamentally different entry points into the same data.
I led workshops with stakeholders across all three agencies to align on a shared taxonomy and navigation model. The key strategic insight was that scientists and policymakers needed fundamentally different entry points into the same data.
I led workshops with stakeholders across all three agencies to align on a shared taxonomy and navigation model. The key strategic insight was that scientists and policymakers needed fundamentally different entry points into the same data.
We designed a dual-path architecture: interactive data stories for policy audiences, and direct dataset access with rich metadata for researchers. Both paths led to the same underlying data, maintaining a single source of truth.
We designed a dual-path architecture: interactive data stories for policy audiences, and direct dataset access with rich metadata for researchers. Both paths led to the same underlying data, maintaining a single source of truth.
We designed a dual-path architecture: interactive data stories for policy audiences, and direct dataset access with rich metadata for researchers. Both paths led to the same underlying data, maintaining a single source of truth.
Cross-functional Decisions
Cross-agency taxonomy alignment
Facilitated workshops with scientists from NASA, EPA, and NIST to create a shared vocabulary for greenhouse gas data categories.
Balancing scientific rigor with accessibility
Worked with atmospheric scientists to decide how much complexity could be abstracted without losing scientific validity.
Defining the MVP scope across agencies
Led prioritization sessions to align three agencies with different priorities around a shared definition of minimum viable platform.
Research the domain
Designing for Decisions
Designing for Decisions
Designing for Decisions
To better understand these needs, I mapped key user goals, motivations, and decision-making journeys, identifying common pathways users followed when exploring greenhouse gas information.
To better understand these needs, I mapped key user goals, motivations, and decision-making journeys, identifying common pathways users followed when exploring greenhouse gas information.
To better understand these needs, I mapped key user goals, motivations, and decision-making journeys, identifying common pathways users followed when exploring greenhouse gas information.
The information architecture was designed around the decisions users were trying to make rather than the datasets available within the platform. By organizing content around locations, sectors, topics, and actions, the experience helped users move from questions to insights.
The information architecture was designed around the decisions users were trying to make rather than the datasets available within the platform. By organizing content around locations, sectors, topics, and actions, the experience helped users move from questions to insights.
The information architecture was designed around the decisions users were trying to make rather than the datasets available within the platform. By organizing content around locations, sectors, topics, and actions, the experience helped users move from questions to insights.

Key dataset discovery pathways synthesized from user flow mapping and stakeholder research.
Key dataset discovery pathways synthesized from user flow mapping and stakeholder research.
Key dataset discovery pathways synthesized from user flow mapping and stakeholder research.
Shape the product system
Turning Data Into Action
Turning Data Into Action
Turning Data Into Action
With the information architecture and user pathways established, I translated the strategy into wireframes and concept designs that explored how users could discover, understand, and act on greenhouse gas information.
With the information architecture and user pathways established, I translated the strategy into wireframes and concept designs that explored how users could discover, understand, and act on greenhouse gas information.
With the information architecture and user pathways established, I translated the strategy into wireframes and concept designs that explored how users could discover, understand, and act on greenhouse gas information.
Early wireframes focused on navigation, content hierarchy, and integrating multiple entry points through locations, sectors, topics, interactive maps, and data tools.
Early wireframes focused on navigation, content hierarchy, and integrating multiple entry points through locations, sectors, topics, interactive maps, and data tools.
Early wireframes focused on navigation, content hierarchy, and integrating multiple entry points through locations, sectors, topics, interactive maps, and data tools.

Concept directions explored multiple entry points through locations, sectors, topics, interactive maps, and data tools.
Concept directions explored multiple entry points through locations, sectors, topics, interactive maps, and data tools.
Concept directions explored multiple entry points through locations, sectors, topics, interactive maps, and data tools.
As the designs evolved, I developed a flexible design system that established reusable patterns for navigation, content pages, interactive maps, data visualizations, dashboards, and storytelling experiences. The resulting high-fidelity concepts balanced scientific credibility with accessibility while creating a scalable foundation for future growth.
As the designs evolved, I developed a flexible design system that established reusable patterns for navigation, content pages, interactive maps, data visualizations, dashboards, and storytelling experiences. The resulting high-fidelity concepts balanced scientific credibility with accessibility while creating a scalable foundation for future growth.
As the designs evolved, I developed a flexible design system that established reusable patterns for navigation, content pages, interactive maps, data visualizations, dashboards, and storytelling experiences. The resulting high-fidelity concepts balanced scientific credibility with accessibility while creating a scalable foundation for future growth.


By combining a cohesive visual language with consistent interaction patterns, the platform could support diverse content types and user needs while maintaining a unified experience across the ecosystem.
By combining a cohesive visual language with consistent interaction patterns, the platform could support diverse content types and user needs while maintaining a unified experience across the ecosystem.
By combining a cohesive visual language with consistent interaction patterns, the platform could support diverse content types and user needs while maintaining a unified experience across the ecosystem.
Visualizing Climate Decisions
Visualizing Climate Decisions
Visualizing Climate Decisions
A key design goal was helping users connect data to decisions, not simply display data.
A key design goal was helping users connect data to decisions, not simply display data.
A key design goal was helping users connect data to decisions, not simply display data.
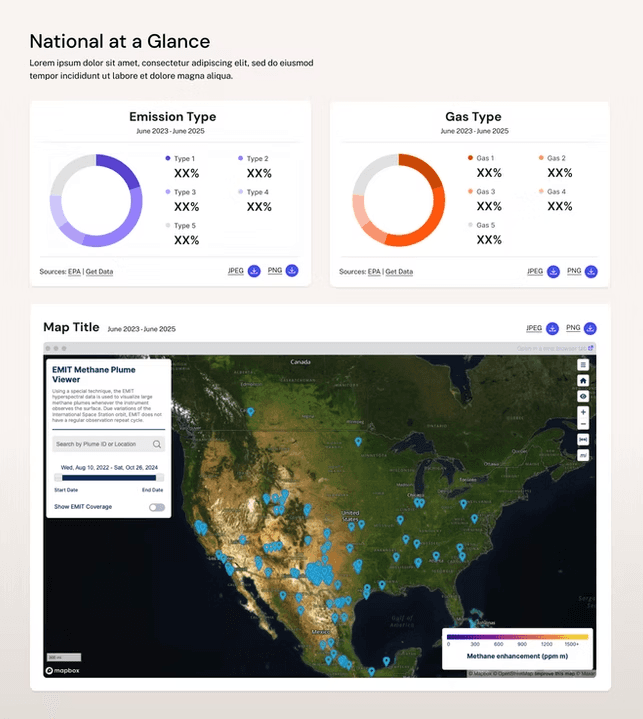
I focused on building tools that allowed users to:
I focused on building tools that allowed users to:
I focused on building tools that allowed users to:
Compare emissions and trends across locations and time periods
Compare emissions and trends across locations and time periods
Compare emissions and trends across locations and time periods
Explore multiple data layers to uncover patterns and relationships
Explore multiple data layers to uncover patterns and relationships
Explore multiple data layers to uncover patterns and relationships
Drill from high-level geographic insights to supporting data and evidence
Drill from high-level geographic insights to supporting data and evidence
Drill from high-level geographic insights to supporting data and evidence
Connect map findings to relevant actions, resources, and case studies
Connect map findings to relevant actions, resources, and case studies
Connect map findings to relevant actions, resources, and case studies
IMPACT
Making Greenhouse Gas Data Actionable
The Greenhouse Gas Center transformed fragmented emissions data into a unified platform that helps researchers, policymakers, and decision-makers explore, interpret, and act on complex climate information with confidence.
Product Strategy
Shifted the platform from data access to climate decision-making.
Information Architecture
Unified fragmented emissions data into a cohesive discovery experience.
INTERACTION DESIGN
Connected data, maps, and insights through intuitive exploration workflows.
Design System
Created scalable patterns for a growing ecosystem of climate products.
✨Principles I Still Design By
Complex data becomes valuable only when people can understand it. Great product design doesn't simplify the science - it reveals the right information at the right time so users can make informed decisions.