Geospatial UX

user research

Interaction Design

National Ecological Observatory Network

Connecting Ecological Data, Research Sites, and Field Observations at Scale

Connecting Ecological Data, Research Sites, and Field Observations at Scale

Connecting Ecological Data, Research Sites, and Field Observations at Scale

Greenhouse Gas Center platform interface concept

Product Outcome

Designed interactive geospatial tools that bridged ecological data with field sites across the United States, improving how researchers discovered and contextualized environmental observations.

Timeline

2015 – 2017

2015 – 2017

2015 – 2017

Role

UX Coordinator

UX Coordinator

UX Coordinator

Reusable Template Slot

Reusable Template Slot

Swap this column for team, scope, tools, constraints, or platform context in future case studies.

Swap this column for team, scope, tools, constraints, or platform context in future case studies.

Swap this column for team, scope, tools, constraints, or platform context in future case studies.

The problem

National ecological observation data disconnected from the spatial and contextual information researchers needed to use it effectively.

National ecological observation data disconnected from the spatial and contextual information researchers needed to use it effectively.

National ecological observation data disconnected from the spatial and contextual information researchers needed to use it effectively.

The National Ecological Observatory Network (NEON) collects ecological data across 81 field sites spanning the United States. But the data existed in isolation from the geographic, environmental, and contextual information researchers needed to make it useful.

The National Ecological Observatory Network (NEON) collects ecological data across 81 field sites spanning the United States. But the data existed in isolation from the geographic, environmental, and contextual information researchers needed to make it useful.

The National Ecological Observatory Network (NEON) collects ecological data across 81 field sites spanning the United States. But the data existed in isolation from the geographic, environmental, and contextual information researchers needed to make it useful.

Additionally, through a partnership with National Geographic, I worked on FieldScope—online mapping tools for environmental data visualization. The tools had usability problems that prevented effective exploration of geospatial data related to environmental change.

Additionally, through a partnership with National Geographic, I worked on FieldScope—online mapping tools for environmental data visualization. The tools had usability problems that prevented effective exploration of geospatial data related to environmental change.

Additionally, through a partnership with National Geographic, I worked on FieldScope—online mapping tools for environmental data visualization. The tools had usability problems that prevented effective exploration of geospatial data related to environmental change.

Product Strategy

Making spatial context a first-class design element

Making spatial context a first-class design element

Making spatial context a first-class design element

I focused on making geographic context an integral part of the data experience rather than a supplementary feature. Interactive maps became the primary interface for exploring research sites, understanding data collection contexts, and discovering relationships between ecological observations.

I focused on making geographic context an integral part of the data experience rather than a supplementary feature. Interactive maps became the primary interface for exploring research sites, understanding data collection contexts, and discovering relationships between ecological observations.

I focused on making geographic context an integral part of the data experience rather than a supplementary feature. Interactive maps became the primary interface for exploring research sites, understanding data collection contexts, and discovering relationships between ecological observations.

Working with National Geographic's web technologists, I improved the usability of FieldScope mapping tools by studying how researchers and educators actually explored geospatial environmental data. The key insight was that users didn't think in terms of data layers, they thought in terms of questions about places.

Working with National Geographic's web technologists, I improved the usability of FieldScope mapping tools by studying how researchers and educators actually explored geospatial environmental data. The key insight was that users didn't think in terms of data layers, they thought in terms of questions about places.

Working with National Geographic's web technologists, I improved the usability of FieldScope mapping tools by studying how researchers and educators actually explored geospatial environmental data. The key insight was that users didn't think in terms of data layers, they thought in terms of questions about places.

I observed usability testing sessions and iterated on designs based on findings, creating a continuous feedback loop between user behavior and design decisions. This research-informed approach was formative for my career-long focus on evidence-based design.

I observed usability testing sessions and iterated on designs based on findings, creating a continuous feedback loop between user behavior and design decisions. This research-informed approach was formative for my career-long focus on evidence-based design.

I observed usability testing sessions and iterated on designs based on findings, creating a continuous feedback loop between user behavior and design decisions. This research-informed approach was formative for my career-long focus on evidence-based design.

Cross-functional Decisions

Geographic context as design pattern

Established interactive maps as the primary interface for exploring NEON's network of field sites, embedding spatial context directly into the data discovery experience rather than treating maps as a supplementary visualization.

Cross-organizational collaboration with National Geographic

Coordinated between NEON's science team and National Geographic's web technologists to improve FieldScope mapping tools, bridging the gap between scientific data requirements and public-facing usability.

Research-informed design iteration

Observed usability testing sessions and translated findings into concrete design iterations. This evidence-based approach ensured that design decisions reflected actual user behavior rather than internal assumptions about how scientists would explore ecological data.

Research and strategy

Designing Around How Scientists Work

Designing Around How Scientists Work

Designing Around How Scientists Work

To understand how scientists evaluated field sites, I reviewed support requests, interviewed stakeholders, and analyzed existing user journeys. Research revealed three recurring needs that became the foundation for the product strategy:


Evaluate sites quickly

Researchers needed an efficient way to determine whether a field site collected the measurements relevant to their work.


Explore geographically

Many users began with location, using maps to discover sites within a region or ecosystem of interest.


Compare before deciding

Scientists frequently evaluated multiple sites before selecting data for analysis.

To understand how scientists evaluated field sites, I reviewed support requests, interviewed stakeholders, and analyzed existing user journeys. Research revealed three recurring needs that became the foundation for the product strategy:


Evaluate sites quickly

Researchers needed an efficient way to determine whether a field site collected the measurements relevant to their work.


Explore geographically

Many users began with location, using maps to discover sites within a region or ecosystem of interest.


Compare before deciding

Scientists frequently evaluated multiple sites before selecting data for analysis.

Testing the Strategy

Testing the Strategy

I conducted moderated usability testing to compare two concepts for discovering and evaluating field sites. Participants consistently preferred the GIS-inspired map experience, completing tasks more quickly and navigating with greater confidence.


The results confirmed that geographic exploration should be the foundation of the product, shaping the final interaction model and information architecture.

Each DAAC manages different scientific data, making a one-size-fits-all template impractical.


Design Decision

Based on the cross-DAAC content inventory to identify shared user needs, I created a modular interaction framework that maintained consistent structure while adapting to each dataset’s unique content.

Each DAAC manages different scientific data, making a one-size-fits-all template impractical.


Design Decision

Based on the cross-DAAC content inventory to identify shared user needs, I created a modular interaction framework that maintained consistent structure while adapting to each dataset’s unique content.

Wireframe concepts for greenhouse gas data platform

Research plan outlining the moderated usability study used to evaluate competing concepts and validate the product strategy.

Research plan outlining the moderated usability study used to evaluate competing concepts and validate the product strategy.

Research plan outlining the moderated usability study used to evaluate competing concepts and validate the product strategy.

Shape the product system

User Testing and Feature Refinement

User Testing and Feature Refinement

User Testing and Feature Refinement

After selecting the second concept to continue, I structured the next couple of weeks around Think-Make-Check sprints. Below is a visual breakdown of the sprint structure and our results/solutions from user testing during the process.

After selecting the second concept to continue, I structured the next couple of weeks around Think-Make-Check sprints. Below is a visual breakdown of the sprint structure and our results/solutions from user testing during the process.

After selecting the second concept to continue, I structured the next couple of weeks around Think-Make-Check sprints. Below is a visual breakdown of the sprint structure and our results/solutions from user testing during the process.

Wireframe concepts for greenhouse gas data platform

WRap Up

Final Thoughts + Map Designs

Final Thoughts + Map Designs

Final Thoughts + Map Designs

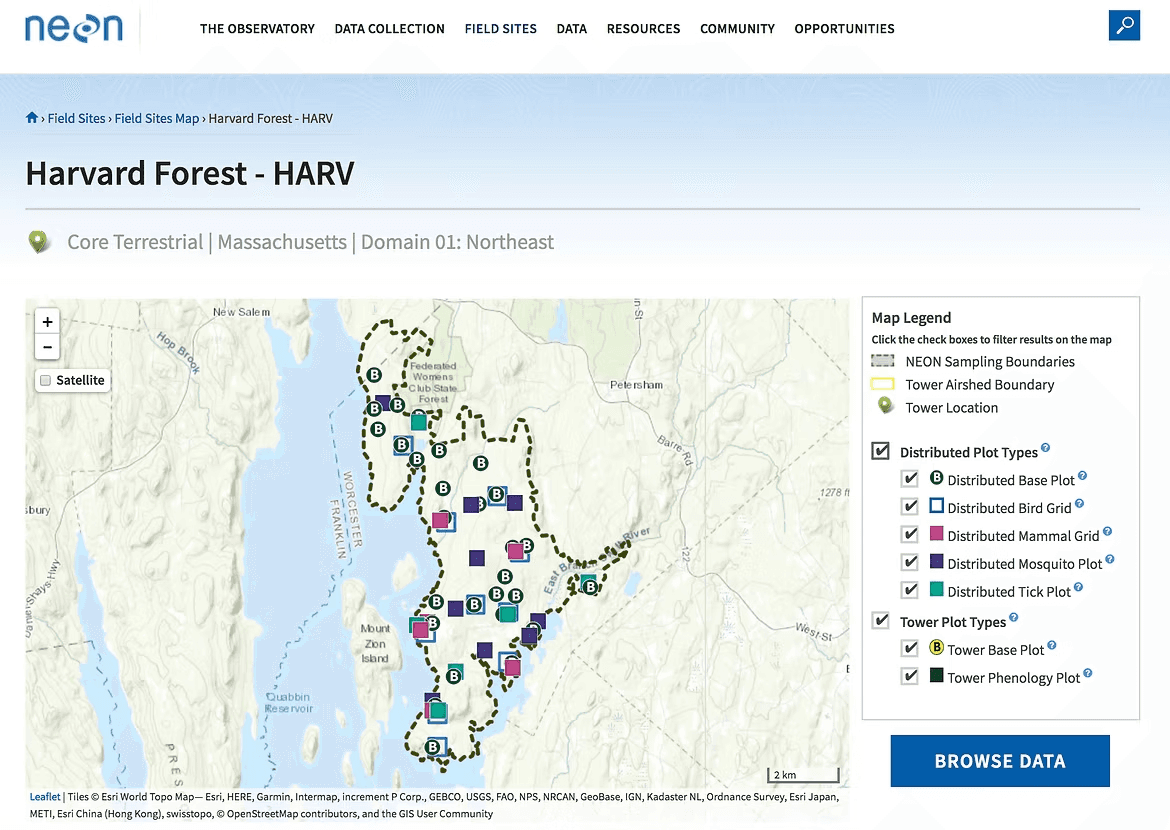
My background in earth and environmental science allowed me to bridge the gap between scientific stakeholders and user experience design, translating complex environmental datasets into intuitive workflows for researchers. Ultimately the interactive field site maps help users locate diverse measurements within NEON field sites, visually understand the unique spatiotemporal sampling design for each site, and get basic metadata information for measurements of interest. 

My background in earth and environmental science allowed me to bridge the gap between scientific stakeholders and user experience design, translating complex environmental datasets into intuitive workflows for researchers. Ultimately the interactive field site maps help users locate diverse measurements within NEON field sites, visually understand the unique spatiotemporal sampling design for each site, and get basic metadata information for measurements of interest. 

Wireframe concepts for greenhouse gas data platform

IMPACT

Transforming Field Site Discovery

By rethinking the experience around researchers' workflows, the redesign transformed disconnected field site pages into an intuitive platform for exploring, evaluating, and comparing ecological research sites.

Product Strategy

Reframed the experience around how researchers evaluate field sites, not how content was organized.

Information Architecture

Connected maps, metadata, and measurements into a unified discovery and evaluation workflow.

INTERACTION DESIGN

Made geographic exploration the primary entry point, helping researchers compare sites with confidence.

Design System

Created reusable patterns that scaled across field sites while adapting to diverse ecological data.

✨Principles I Still Design By

Great product design starts with how people think, not how information is stored. Organizing experiences around users' workflows makes complex scientific data easier to explore, evaluate, and trust.

Next

Turn another complex product story into a clear case study.

Turn another complex product story into a clear case study.

Turn another complex product story into a clear case study.